Key figures
The table below contains key figures on the Renault group by year, as published. For previous years and restated figures, an Excel file is also available.
| (in million euros - otherwise stated) | 2019 | 2020 | 2021 | 2021(8) | 2022 | 2022(9) | 2023 |
| Worldwide Group sales (1) | 3 754 | 2 952 | 2 696 | 2 180 | 2 051 | 2 051 | 2 235 |
| Group revenue | 55 537 | 43 474 | 46 213 | 41 659 | 46 391 | 46 328 | 52 376 |
| Group operating margin | 2 662 | -337 | 1 663 | 1 153 | 2 595 | 2 570 | 4 117 |
| in % of revenue | 4,8% | -0,8% | 3,6% | 2,8% | 5,6% | 5,5% | 7,9% |
| Associated income from Nissan Motor | 242 | -4 970 | 380 | 380 | 526 | 526 | 797 |
| Net income | 19 | -8 046 | 967 | 967 | -700 | -716 | 2 315 |
| Net income, Group share | -141 | -8 008 | 888 | 888 | -338 | -354 | 2 198 |
| Basic earnings per share (in EUR) | -0,52 | -29,51 | 3,26 | 3,25 | -1,24 | -1,30 | 8,11 |
| Dividend per share (in EUR) (2) | 0,00 | 0,00 | 0,00 | 0,00 | 0,25 | 0,25 | 1,85 |
| Automotive cash flow after tax and interest (3) | 4 144 | 1 523 | 3 997 | 3 697 | 4 228 | 4 228 | 4 989 |
| Automotive tangible and intangible investments net of disposals (4) | -4 846 | -3 827 | -2 186 | -2 107 | -2 203 | -2 203 | -2 632 |
| Automotive net cash position (5) | 1 734 | -3 579 | -1 622 | -1 100 | 549 | 549 | 3 724 |
| Shareholders' equity (5) | 35 331 | 25 338 | 27 894 | N/A | 29 539 | 29 690 | 30 634 |
Table updated on 2024.02.15
(1) In thousand units. Group registrations include LADA 2016-21, Jinbei & Huasong 2018-20
(2) The proposed dividend for the financial year 2023 will be submitted for approval at the Annual General Meeting on May 16, 2024
(3) From 2009, the consolidated cash flow doesn't include the dividends from the associated companies. Data for Automotive excluding AVTOVAZ
(4) Data for Automotive excluding AVTOVAZ
(5) Between 2016 and 2021, Net cash position and Shareholders' equity include AVTOVAZ
(6) Between 2017 and 2021, AVTOVAZ is consolidated within Renault Group
(7) Shareholder's equity at December 31, 2018 has been adjusted by an amount of -€57 million due to correction of an error concerning operations in the Americas Region, with a corresponding entry in provisions for risks on taxes other than income taxes
(8) The 2021 financial statements have been adjusted in application of IFRS 5 due to the discontinued operations in the Russian Federation. In 2022, operations in the Russian Federation have been deconsolidated from Renault Group
(9) The 2022 figures include restatements following the first application of IFRS 17 "Insurance contracts" in 2023
Monthly sales
Monthly sales for the Renault group.
Revenues
| IN MILLION EUROS | |||
| 2022 (1) | 2023 | Change | |
| Automotive | 43 121 | 48 150 | +11.7% |
| Sales Financing | 3 172 | 4 181 | +31.8% |
| Mobility Services | 35 | 45 | +28.6% |
| Group revenue | 46 328 | 52 376 | +13.1% |
Table updated on 2024.02.15
(1) The 2022 figures include restatements following the first application of IFRS 17 "Insurance contracts" in 2023.
Income statements
| (in million euros - otherwise stated) | 2019 | 2020 | 2021 | 2021(3) | 2022 | 2022 (4) | 2023 |
| Group revenue | 55 537 | 43 474 | 46 213 | 41 659 | 46 391 | 46 328 | 52 376 |
| Group operating profit | 2 662 | -337 | 1 663 | 1 153 | 2 595 | 2 570 | 4 117 |
| Operating income | 2 105 | -1 999 | 1 398 | 900 | 2 216 | 2 191 | 2 485 |
| Net financial income | -442 | -482 | -350 | -295 | -486 | -486 | -527 |
| Associated income from Nissan | 242 | -4 970 | 380 | 380 | 526 | 526 | 797 |
| Contribution from associated companies | -432 | -175 | 135 | 135 | -103 | -103 | 83 |
| Pre-tax income | 1 473 | -7 626 | 1 563 | 1 120 | 2 153 | 2 128 | 2 838 |
| Current and deffered taxes | -1 454 | -420 | -596 | -571 | -533 | -524 | -523 |
| Net income | 19 | -8 046 | 967 | 967 | -700 | -716 | 2 315 |
| Net income - non-controlling interests' share | 160 | -38 | 79 | 79 | -362 | -362 | 117 |
| Net income - parent-company shareholders' share | -141 | -8 008 | 888 | 888 | -338 | -354 | 2 198 |
| Earnings per share (in Euros) | -0,52 | -29,51 | 3,26 | 3,25 | -1,24 | -1,30 | 8,11 |
Table updated on 2024.02.15
(1) From 2004, all figures are restated for compliance with IFRS
(2) From 2017 to 2021, AVTOVAZ is consolidated within Renault Group
(3) The 2021 financial statements have been adjusted in application of IFRS 5 due to the discontinued operations in the Russian Federation. In 2022, operations in the Russian Federation have been deconsolidated from Renault Group
(4) The 2022 figures include restatements following the first application of IFRS 17 "Insurance contracts" in 2023
Dividends
2024 Dividend:
- €1.85 per share
- Payment method: cash
- Ex-dividend date: May 22, 2024
- Record Date: May 23, 2024
- Payment date: May 24, 2024
2023 proposed dividend is subject to Shareholders' Annual General Meeting approval on May 16, 2024
Last 5 dividends
| In €/share | FY 2019 paid in 2020 | FY 2020 paid in 2021 | FY 2021 paid in 2022 | FY 2022 paid in 2023 | FY 2023 paid in 2024 |
| Dividend | 0 | 0 | 0 | 0,25 | 1,85 |
For more historical data, please refer to KEY FIGURES FROM PREVIOUS YEARS
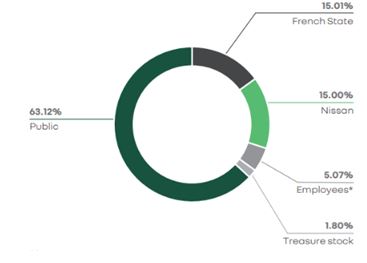
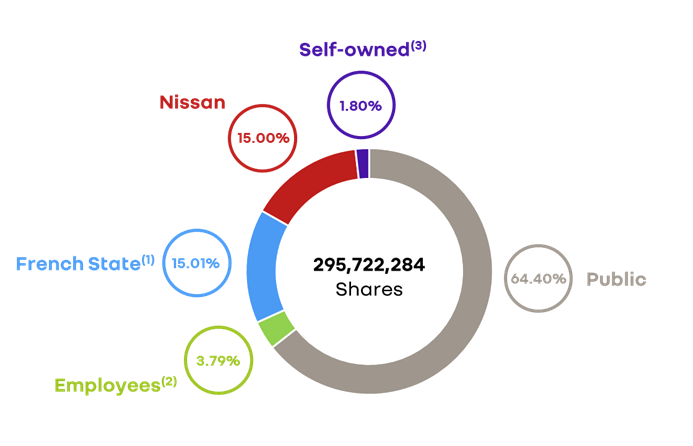
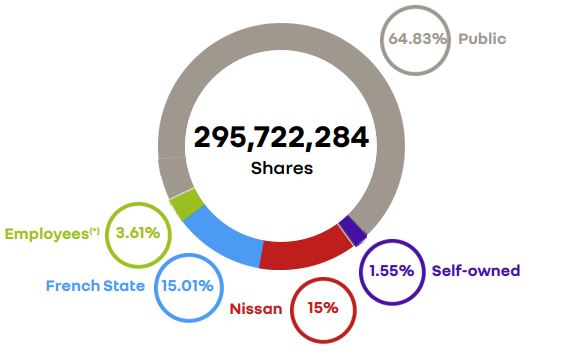
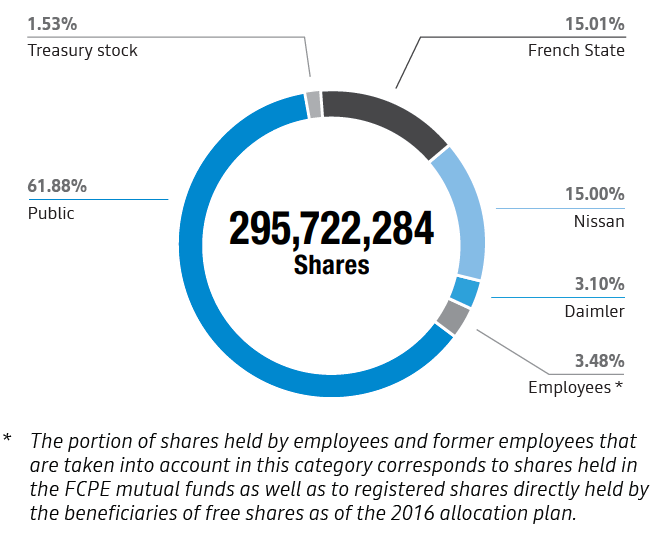
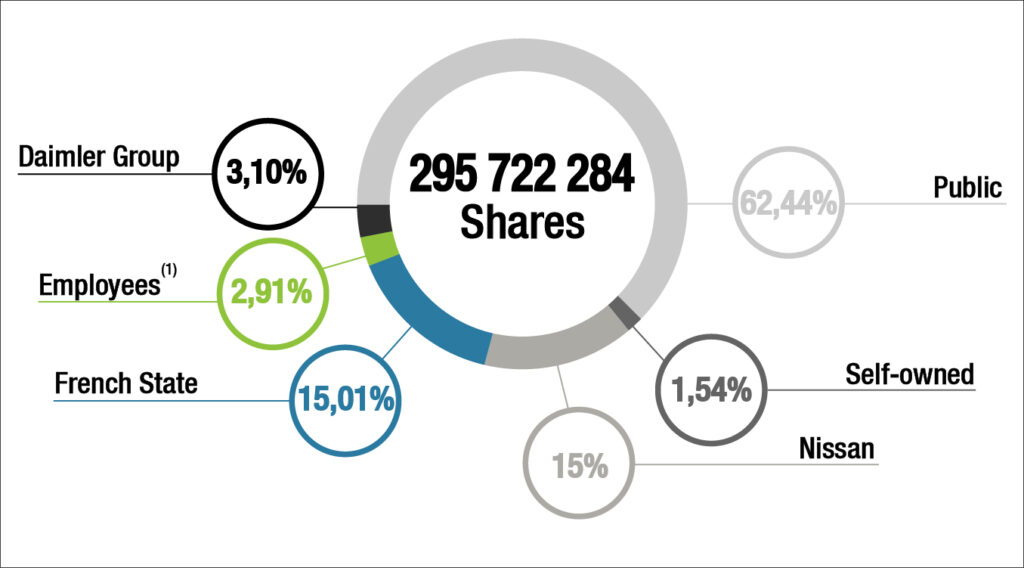
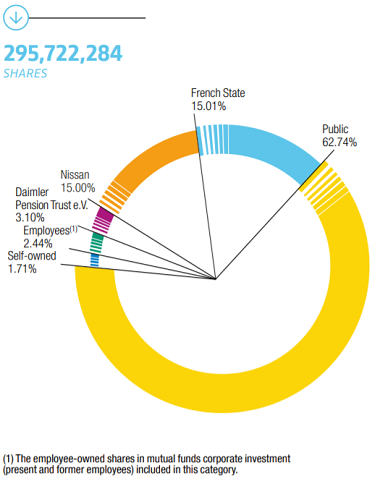
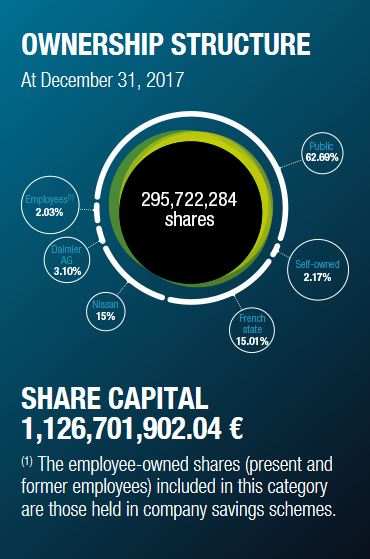
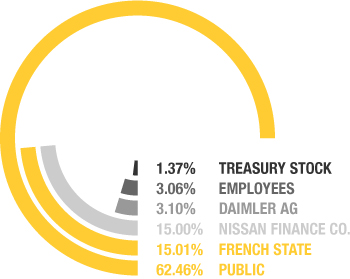
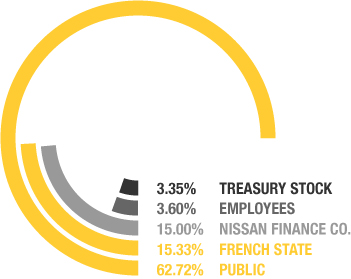
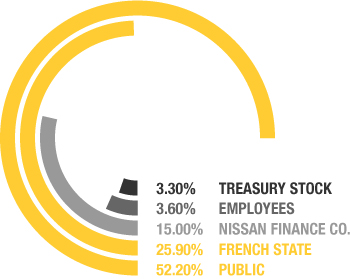
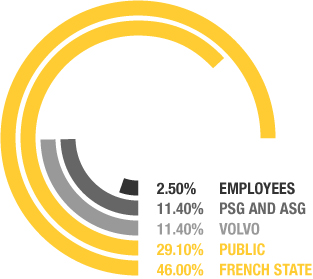
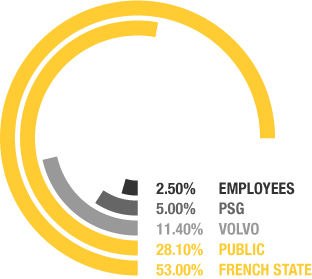
Renault Group stockholder structure
STRUCTURE AT DECEMBER 31, 2023
